AI spreadsheet data visualization
Transform your spreadsheet chaos into visual insights with AI using Grist. Chat in plain language to prepare data, build summaries, and create interactive dashboards — no coding required.
AI + Grist for better data visualization
Grist natively turns messy data into clear visuals with flexible widgets, dynamic interactions, and custom options — going beyond basic spreadsheets for dashboards that fit your needs.
With Grist’s AI, cut setup time with natural language chats to prep data, style elements, and link widgets, all enhancing core features like:
- Drag-and-drop layouts for custom dashboards
- Charts with advanced options (log scales, error bars)
- Card views and calendars for record details and events
- Community widgets gallery (interactive maps, Kanban boards)
Chat your way to clean, chartable data
The hardest part of creating a great chart isn’t choosing the colors — it’s getting your data ready. No need to be a Python or spreadsheet expert. Chat with Grist’s AI in plain language, like summarize sales by region and quarter.
Grist’s AI creates formulas to build a summary table, formatted and set for your charts or other widgets. Need adjustments? Just chat more.
Style your data for aesthetic visuals
Numbers tell stories, but good styling makes them stick. Chat with the AI to format currencies, color-code choices, or align dates just right.
Get your data looking sharp for tables, cards, or charts.
Build interactive dashboards with AI-powered insights
Build dynamic dashboards by dragging and dropping tables, cards, charts, and more into layouts. Link widgets so picking a department, for example, updates everything related — like employee details or budget views.
The AI helps by creating summary tables with your groupings, like group investments by year and category. It handles the formulas, so you can focus on insights and arrange the rest.
Visualize your entire data landscape
Your data doesn’t live in a single, flat table—it’s interconnected. Grist is a relational spreadsheet, blending spreadsheet familiarity with database power. Unlike traditional spreadsheets that fumble with relational data, Grist lets you connect tables via references, and our AI understands these links natively.
Chat across your whole dataset. Ask to group sales from the sales table by customer industry from the customers table, and the AI creates a summary table with the grouped data. It handles cross-table relationships automatically, populating the results so they’re ready to visualize — like adding a quick pie chart widget.
Debug and refine your visualizations instantly
If a chart looks off, it’s often the formula behind it. Skip decoding errors — chat with the AI instead.
Ask why is this formula broken? and it explains, suggests fixes, and improves the code.
Grist is Python native. The AI knows your data — and is aware of the current document being viewed — turning debugging into an easy chat.
Beyond built-in charts
Need more than pie charts and bar graphs? Grist’s custom widgets unlock endless options. Try interactive maps for locations, calendars for events with drag-and-drop editing, or advanced Plotly charts for science work.
The AI preps your data with formulas and summaries for any widget — from our gallery, community adds, or your custom builds. Plus, embed live pages with charts and tables into your site. They update automatically as data changes, keeping everything current.
AI power with privacy
You control the data flow. Grist’s AI moves your queries, structure, and data only when you submit a request. See our documentation.
Spreadsheet data visualization with AI
From cleaning raw numbers to building interactive dashboards, chat with Grist’s embedded AI to clean, analyze, and visualize your data.
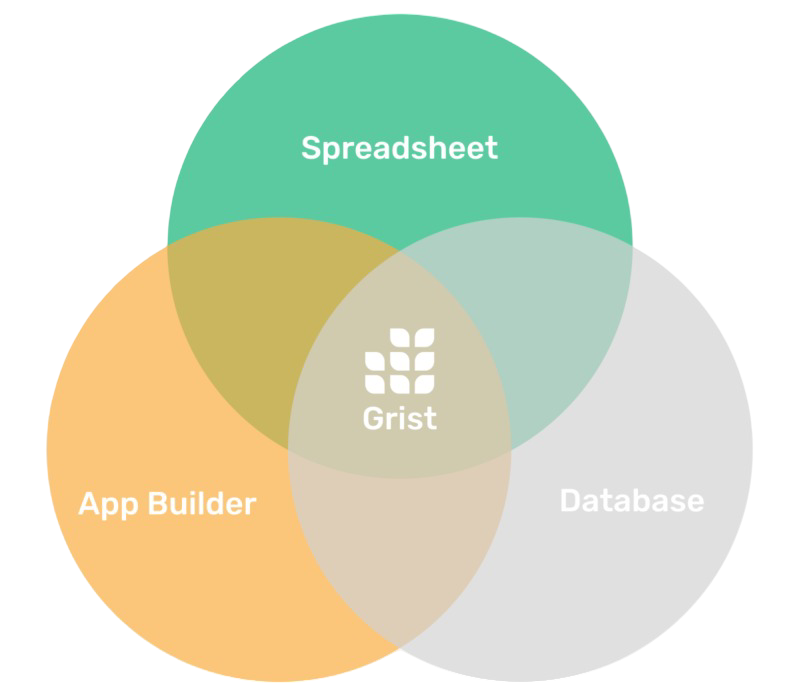
What is Grist?
Grist is a modern, flexible spreadsheet-database hybrid that combines familiar interfaces with the power of relational data. It lets you manage and view your data exactly how you want – with proper relationships, validation rules, and data integrity built in.
With Grist’s embedded AI, visualizing your data becomes as easy as a chat.
Additional information
Frequently Asked Questions
What kind of visualizations can I create?
Grist has built-in charts like pie, bar, line, and donut, plus summary tables for dashboards you arrange with drag-and-drop. For more, check our custom widgets gallery — think interactive maps, calendars, advanced Plotly charts, and community extras like Kanban boards.
Grist’s AI preps your data with formulas and formatting, so it’s ready for any widget.
What the AI can (and can’t) do for your visuals
The AI shines at formulas, summaries, styling, adding widgets, and linking them. It can even create new pages or answer data questions.
But for full accuracy, know it doesn’t build charts directly or rearrange layouts — you handle the drag-and-drop. It’s your sidekick, not the boss.
How is Grist different from making charts in Excel or Google sheets?
While Excel and Sheets are great for simple charts on a single sheet, Grist’s AI Assistant helps you visualize data that lives in a relational database structure.
It uses AI-generated Python formulas to perform complex data cleaning, summarization, and analysis across multiple connected tables — tasks that are difficult and manual in traditional spreadsheets.
Do I need to know Python to prepare data for visualization?
No. The AI Assistant is designed for users who want the power of Python without its complexity. You describe the data summary you want to visualize in natural language, and the Assistant generates the correct Python formulas for you instantly.
Is there support documentation for the Assistant & Python?
Please find the Assistant support documentation in the Help Center as well as supported Python versions.