Are you an Excel expert? Have you pushed Google Sheets so far that your browser crashed? This post is for you!
At first glance, Grist looks like just another spreadsheet software: a grid of rows and columns, charts, formulas… But there are a few key differences that you should know before diving in – differences that are core to Grist’s power.
Let’s start with the absolute basics:
What is a table?
Grist’s architecture means that even a basic table behaves differently than in Excel or Google Sheets. But for a good reason!
Grist separates data from its representation. Essentially, store data once, then manipulate, analyze and view in many ways.
Grist’s Raw Data page shows the source data from which all other views are made. These views are displayed as widgets – which include tables, cards and charts. These widgets can also represent summarized data – similar to pivot tables (but more on that later).

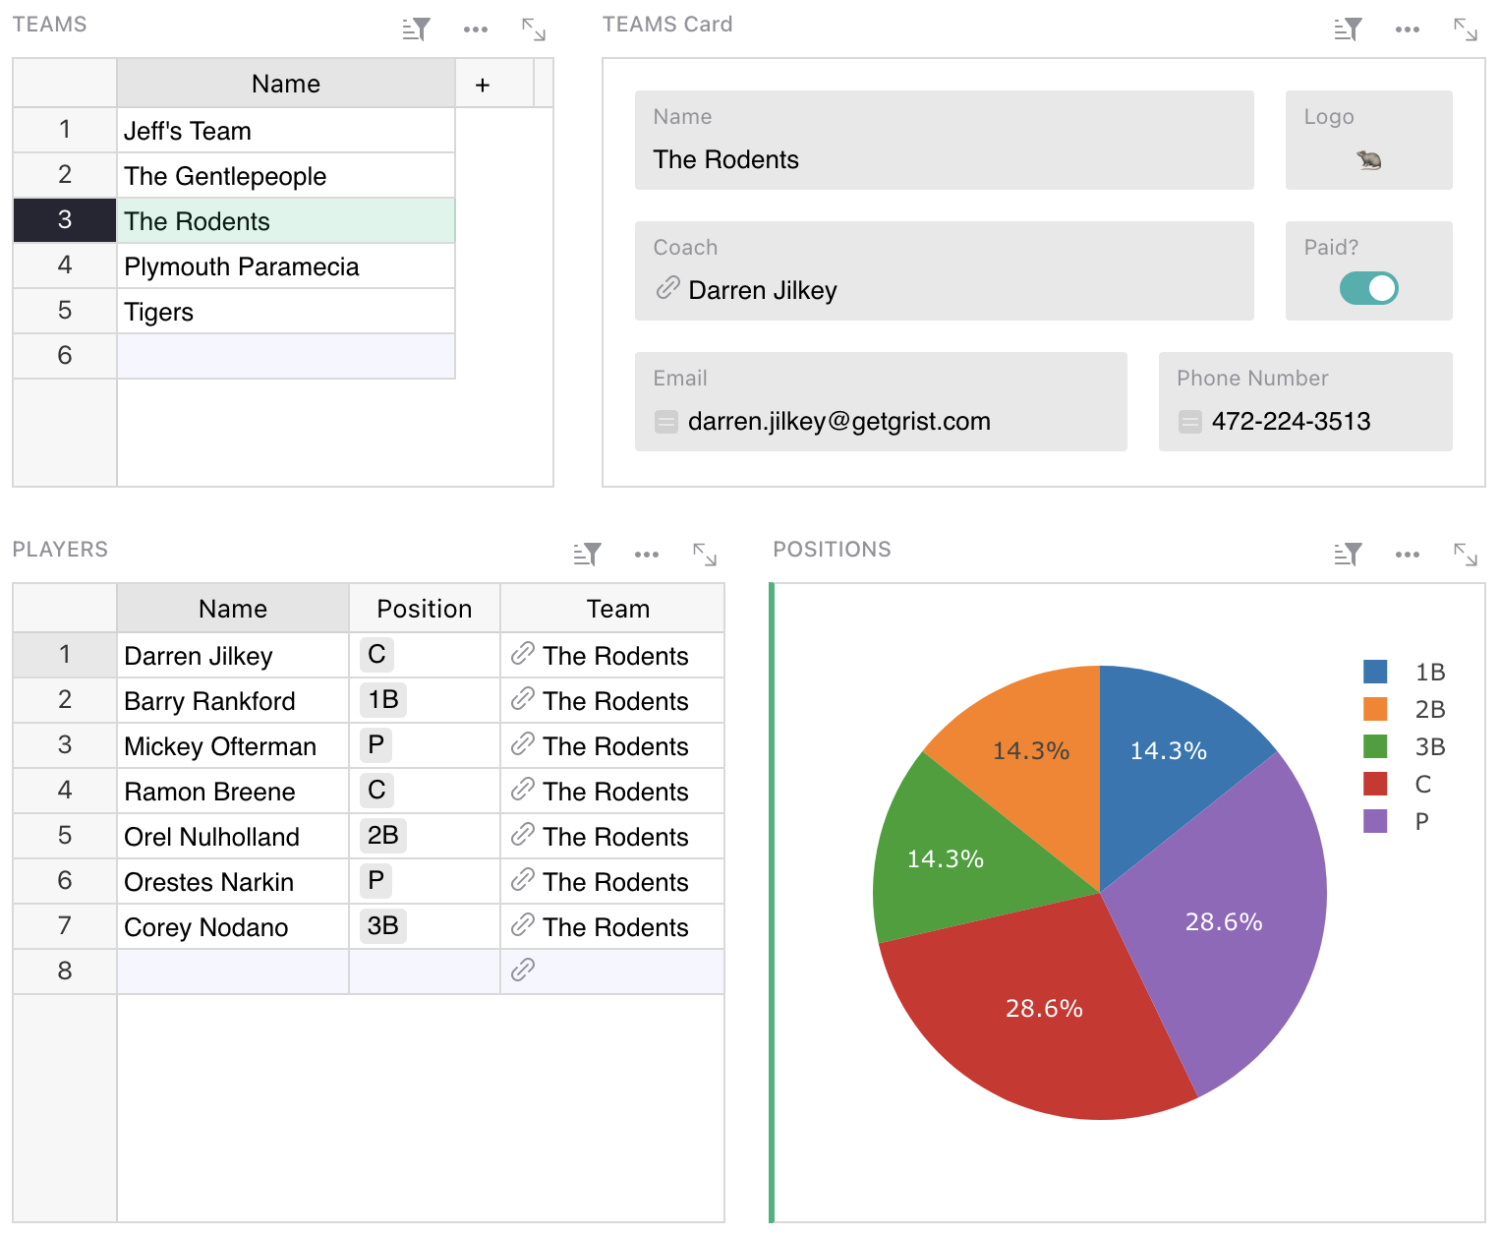
For example, let’s say you’re running a sports league. Instead of making a new sheet for each team, you add all players to a single table and have a Team field. Then, you can create a linked view to filter the data by your selected team.

There are several benefits:
- Any structural changes (e.g. formulas, column formatting, etc) will apply to all teams without having to manually copy changes.
- You can summarize data easily across all teams.
- You can create views linked in a different way (e.g. if each player is tied to a position, you could create another view to select a position and see all the players at that position).
These linked, dynamic dashboards can be customized with views of data from different tables, like so:

What is a row?
In a normal spreadsheet, rows and columns are more or less interchangeable. Grist structures information like a database, treating each row as a unique entry – a record. Pretty simple.
To keep data consistent, records of the same kind have the same fields. This is where columns come in.
What is a column?
Continuing the database comparison: if a Grist row is a record, a column is a field. For instance, these two views show the exact same data, just in a different way.

One more important thing: because rows share the same structure, column types (text, number, date, etc.) and formulas apply to all rows automatically. If you enter a formula in one cell of a given column, it will apply to the entire column, always. This is a key difference between Grist and Google Sheets/Excel.
Like so:

This database-like structure is more rigid than a raw spreadsheet, but has huge benefits when you start working with data.
For example, you can’t create a bunch of random tables in one sheet:

But this approach often leads to broken data anyways, something Grist is designed to prevent!
That doesn’t mean that similar setups aren’t possible in Grist – quite the opposite. Using Grist’s layout system, you can design any number of dashboards, all without duplicating or contaminating data.
Summarizing data
One more thing about Grist columns to keep in mind: you can’t get the sum of a column in the last row of a table. This sounds trivial, but it’s a very common use case in Google Sheets and Excel. You can, however, get “quick sums” by highlighting cells, like so:

Summarizing column information in Grist is done using Summary Tables, which are similar to pivot tables. The table above summarizes the Players table based on their position. There are three catchers, for example. You can identify summary tables by the summation or sigma (Σ) icon to the left of the widget title.
With these structural concepts in mind – data in one place, rows as records, and consistent columns – let’s take a look at one of the main tools seasoned spreadsheet users have at their disposal: formulas.
What is a formula?
Grist supports many common spreadsheet functions, such as IF(), DATEADD(), and CONCATENATE(). Here’s the whole list!
But Grist has a secret. Behind these classic IF()s and AND()s lies Grist’s Python-powered data engine.
Use familiar formulas (remembering that they apply to entire columns!), or unlock the power of Python to do almost anything. From simple string operations like getting the last word of a string…

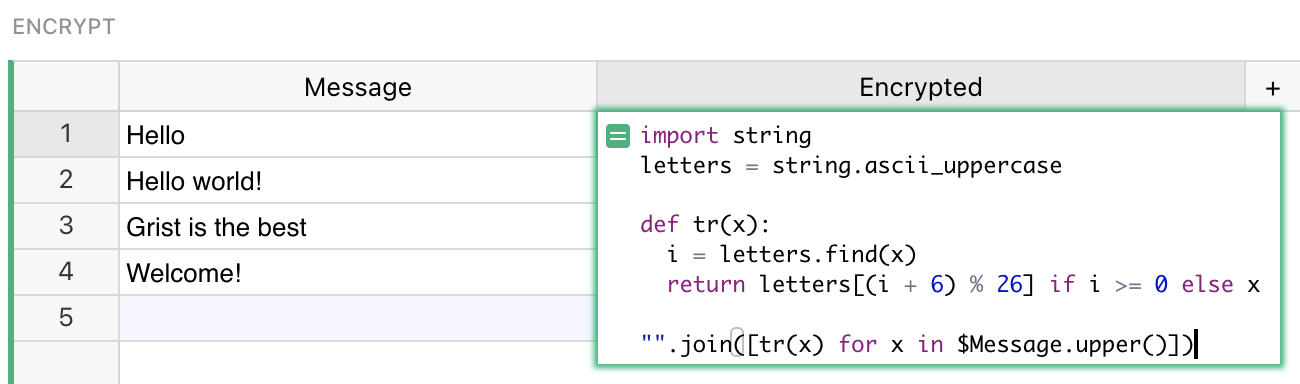
…to more complex Python functions, like this Caesar cipher – all in Grist, no plugins required.
Bonus feature: Access Rules
Since transforming your data is so easy with Grist, you can invest your time efficiently by only adding the raw data once and in one place. This also simplifies collaboration, allowing entire teams to work from a single source of truth, adding and viewing data without duplicating anything.
But it gets better – Grist has a sophisticated permissions system of Access Rules, allowing admins to assign roles and show and hide data down to the cell. Access Rules are the key to interdisciplinary collaboration, eliminating the need to create offshoot documents for specific team members. No duplicate documents means far less maintenance risk, ensuring every team member is looking at accurate and up-to-date data.
Recap
1. Data separate from display
Add data once, view however you like.
No more endless tabs of duplicated sheets and pivot tables and filtered views. With your data properly structured, you have a solid foundation from which to experiment.
Create dashboards with custom widgets that transform and display your information exactly how you need, knowing your source data remains undisturbed.
2. Rows and columns behave differently – for a reason
Think like a database: rows are individual records with set fields (columns). And when you apply a function, it applies to the entire column!
Transformations you’d normally do in a pivot table are done with Summary Tables, which can be incorporated into dashboards along with other widgets.
3. Functions are Python-powered
You don’t need to know any Python to use Grist or manipulate data – most Excel and Google Sheets functions are built-in. However, you are free to leverage the full power of a tried and tested programming language to get exactly what you want out of your information.
To see examples of how Grist can be used, take a look at our many spreadsheet templates. Need additional help adapting your spreadsheet workflow to Grist? Schedule a free coaching call with one of our experts.