How an agency went from Sheets to a fully custom dashboard using Grist + AI
Lots of people love spreadsheets. They love the grid, the cells, the familiar structure – it’s why they’re such a big part of Grist’s interface.
But Evan Buxton wanted to go off the grid.
Using Grist and some AI help, he built a searchable project database with clickable cards and drill-down details, a utilization dashboard with interactive charts and trend analysis, and automated data pipelines pulling from external tools. Each project revealed another layer of what Grist’s platform could do, all with a custom frontend UI made to his exact specifications.
“The tools that Grist provides to make tables are very nice, and dashboards and charts,” Evan explained during his GristCon 2025 presentation. “I wanted more.”
And the tools Grist provides, plus some knowhow from Evan, gave him more. Grist’s relational database structure handled his organizational problems, the API opened up external integrations, and the custom widget framework let him build whatever interfaces he could imagine. Here’s how.
Piles of projects, zero connection
Three years ago, Evan’s team at Neoscape, a Boston-based creative agency, had accumulated years of project data across a sprawling Google Sheets setup.
“What I started with was a very deep spreadsheet in Google” he recalled. “Lots of tabs. And none of it connected, of course.”
Relational tables represented as grids work well enough for most use cases. He had a thousand projects in his database and utilization data flowing in from time tracking software, with teammates across the company who needed access to this information but weren’t going to dig through spreadsheet views to find it.
So, he used Grist’s foundation to start building custom interfaces that suit exactly his team’s needs.
Building on top of a database
What makes this possible is Grist’s extensibility. The platform doesn’t lock anyone into predefined widgets or force you to work within narrow constraints. Grist allows relational data structure, full API access, and a custom widget framework that lets users bring advanced scripting to any document.
For builders who want complete control over their interfaces, or for cases where standard widgets aren’t quite doing what you need, Grist gives them the keys and gets out of the way.
“Anyone can do this,” Evan said. “You just need some AI, the right way to write a prompt, your Grist API key, and GitHub Pages.”
The result is fully interactive dashboards that pull real-time information from Grist and display it however he wants.
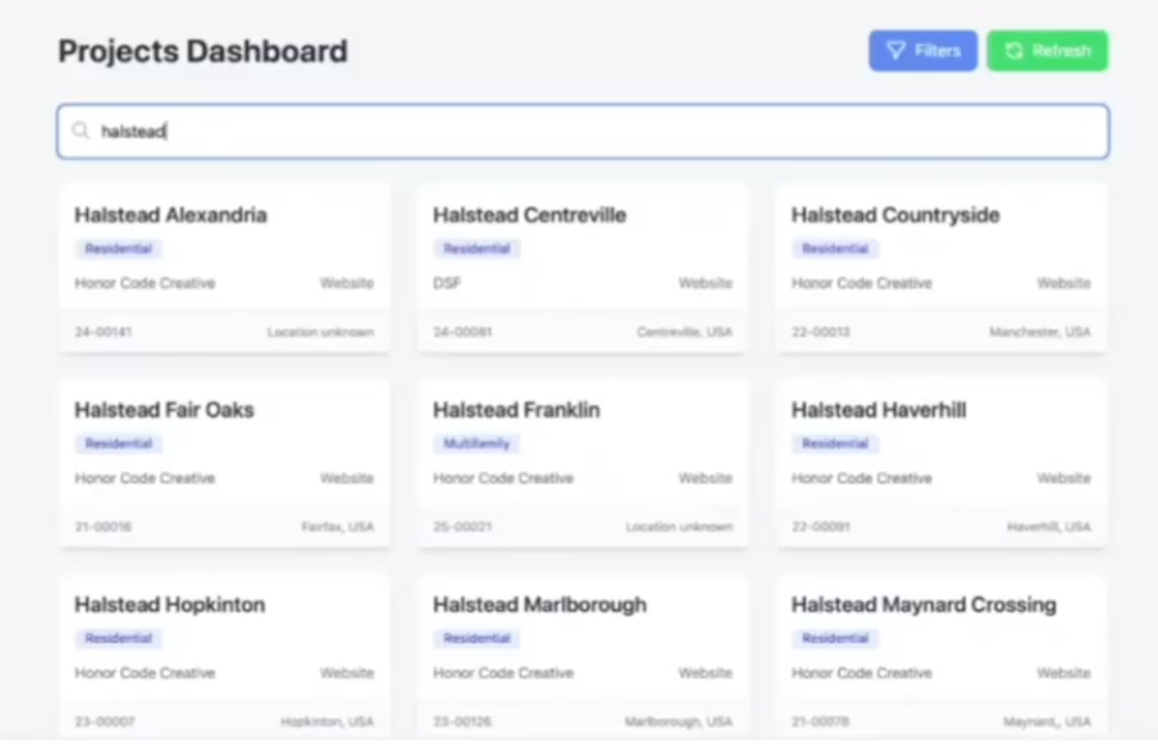
Evan’s fully searchable project database that goes beyond the grid.
A searchable archive for a thousand projects
Neoscape produces creative work for real estate clients, which means the agency accumulates projects quickly. Finding relevant past work when pitching new clients used to mean clicking through folders and hoping you remembered where things lived.
Evan built a searchable project dashboard that treats the Grist database like a user-friendly archive. Type any term and get instant results displayed as clickable cards instead of rows and columns.
The interface returns every project matching the search. Click a card and a detail panel shows the information people actually need: salesperson, project manager, year, and project status. More importantly, it surfaces links: direct connections to the live website they built for the client, the PandaDoc proposal, the HubSpot record, the marketing drive folder with case study images and films – all accessible with a simple search.
“Someone says, ‘This is the exact project I need to show to sell another job,'” Evan explained. “They can click that link and open up the marketing drive directly to the case study. Maybe there’s 10 images in there. Maybe there’s a film.”
The dashboard turns previously siloed information into something accessible, complete with the snazzy UI typically reserved for internally-developed apps.
“We can very easily make dashboards, search, and actually analyze the information now, instead of having to click through different tabs.”
–Evan Buxton, Interactive Director Principal

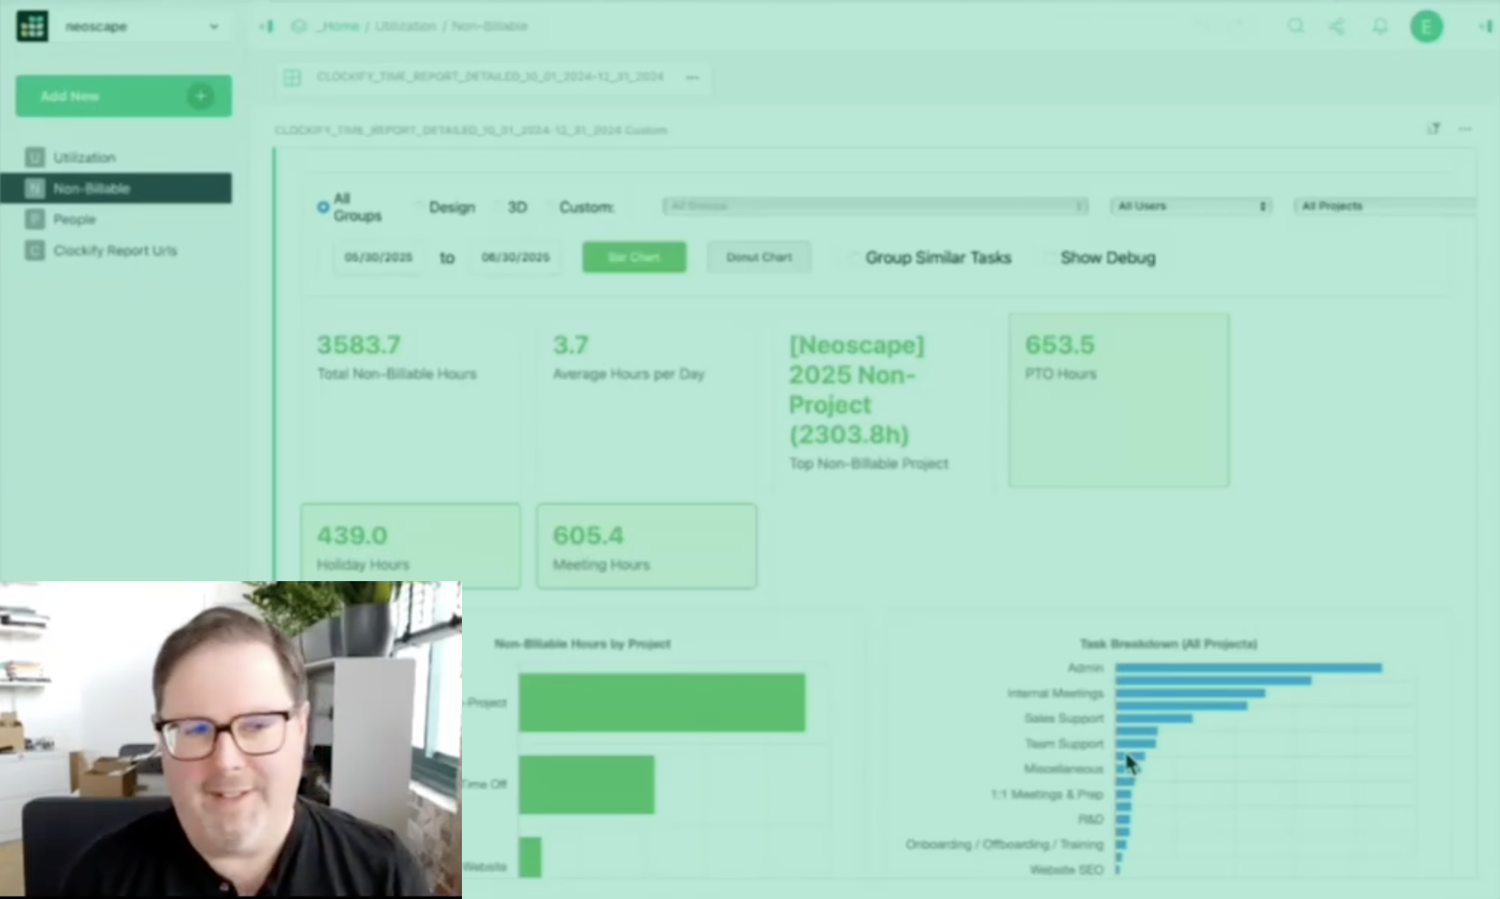
Evan’s utilization dashboard, complete with custom UI made using Claude.
Visualizing where time actually goes
The second dashboard tackles a different problem – time tracking.
Evan set up n8n automations that pull time data from Clockify and dump it into Grist. The custom dashboard visualizes that data with bar charts showing billable versus non-billable time, trend lines against targets, and filters for person, team, quarter, or year.
Click any bar and the interface drills down to individual time entries, including whatever description the person entered when logging their hours.
“We can now investigate where all of that extra time is going for everyone,” Evan said. “Is it too many meetings? Are we having too many people in those meetings?”
The visual approach surfaces patterns that would stay buried in raw time entries: green bars for billable work, orange for non-billable, a red trend line showing targets. These charts turn spreadsheets into stories.
“Tables are good, dashboards are better, and clean visuals are where insights can jump out.”
–Evan Buxton
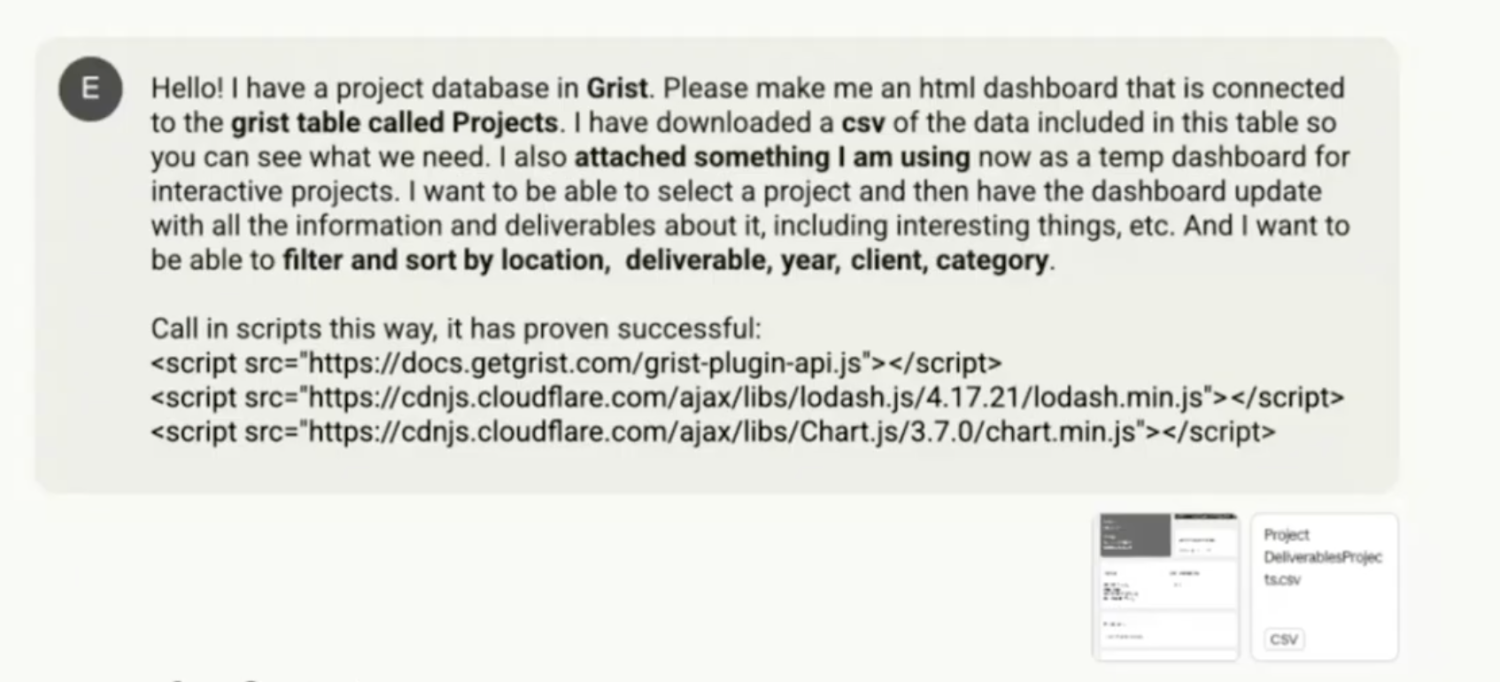
Evan’s go-to prompt in Claude AI to begin new custom widget creation.
Prompting your way to custom dashboards
Evan isn’t a full-time developer. He has programming background, but his day job is in operations. His custom widgets exist because AI tools make code generation accessible, and something he believes everyone can do.
His process is methodical:
- Provide context. Table names, schema structure, a CSV export with dummy data so the AI understands what it’s working with. Never paste real information or your API key into prompts.
- Set expectations. “I always ask it to plan and then ask me questions to make sure it completely understands what I want to build,” Evan explained. “I don’t expect it to one-shot it by just hitting enter and then have it write the code.”
- Correct recurring mistakes. The AI kept getting Grist’s API import syntax wrong, so Evan started pasting the correct format directly into his prompts. Context, table names, examples of data, and the details. That combination produces a workable starting point.
- Iterate. The first output rarely works. Evan’s initial project search dashboard had broken filters, auto-opened the wrong project, and failed to populate dropdown menus correctly. He worked through each issue with the AI until things functioned.
“You can get very, very far with AI,” he said. “You can engineer almost anything. You just have to know how to ask for it.”
He prefers Claude for Grist-related code generation. “I feel like Claude does a better job of writing code. Maybe it’s the way I talk to it, but it understands me.”

Hosting a custom widget in Grist
The implementation details matter for anyone wanting to build advanced frontends on their own.
Hosting happens on GitHub Pages, which is free and simple. Upload your HTML, JavaScript, and CSS files, enable Pages in repository settings, and you get a URL.
That URL goes into Grist’s custom widget configuration. Paste it in, grant full document access so the widget can read your data, and the connection is live.
If you want to build this yourself, see exactly how Evan does it in his full GristCon talk.
When to go off the grid
Evan’s philosophy isn’t “build custom widgets for everything.” Grist’s tables, charts, and built-in widgets handle most use cases, and fighting with AI-generated code when a standard view would suffice wastes time.
“Grist provides a lot of value already,” he said. “Don’t overbuild. Use what they provide. It’s really good. Sometimes though, you might want to go overboard.”
When you need an interface that looks and behaves exactly how you imagine it, when native widgets can’t quite get you there, and when the people using the data need something that feels more like an app – that’s when Grist’s extensibility matters.
“The data is now less intimidating for non-technical teammates. They don’t see tables, they see stories.”
–Evan Buxton
Ready to build with Grist?
Grist’s custom widget framework, full API access, and self-hosting options give builders the infrastructure to create exactly what they need. Start with a spreadsheet, then break out when you’re ready.