Sales Commission Template

About the sales commission sheet template
Simplify your sales commission structure and process by allowing sales reps to enter their own data, while this spreadsheet automatically calculates their sales commissions. Dynamic charts reflect revenue and payout data in real-time. Granular permissions ensure sales reps can only access their own sales and commission details, while viewing a leaderboard of total sales by rep.
This Grist spreadsheet template is more advanced than what a Google Sheet or Excel document is capable of, while maintaining a structured format that ensures easy editing and collaboration.
Customize this commission sheet template to match your organization’s needs. Any sales team can tailor this workflow to match their commission structure, no matter how unique. Learn how with our Modifying Grist Templates webinar.
- Summarize revenue and payout from commission calculations in charts.
- Look up sales performance by rep with a click to see if sales targets have been met.
- Access rules limit sales reps to only enter and see their own data and commission structure in detail.
Categories
How to use this free commission sheet template
Sales and accounting teams can use this free template to track sales and commission. Sales reps only see their individual sales, and the overall leaderboard. Management can see everything. Be sure to watch our Sales + Commissions webinar to learn more.
How to use the Sales by Rep page
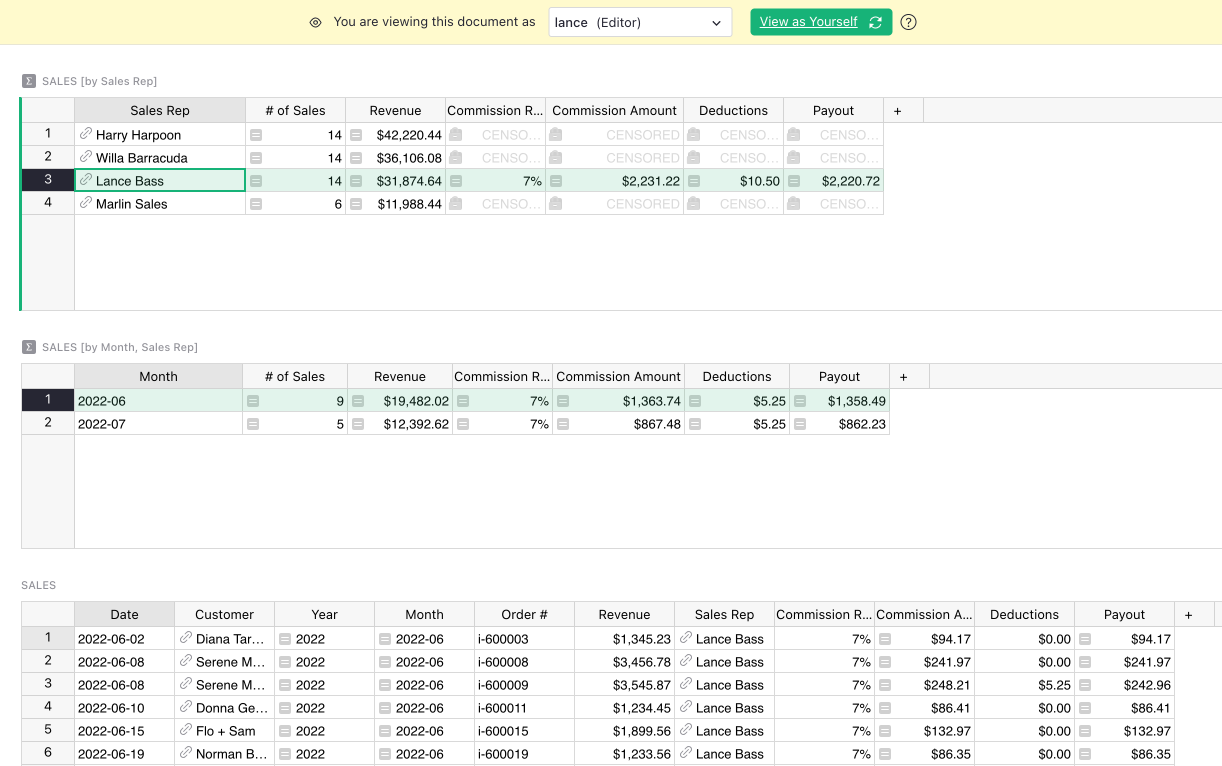
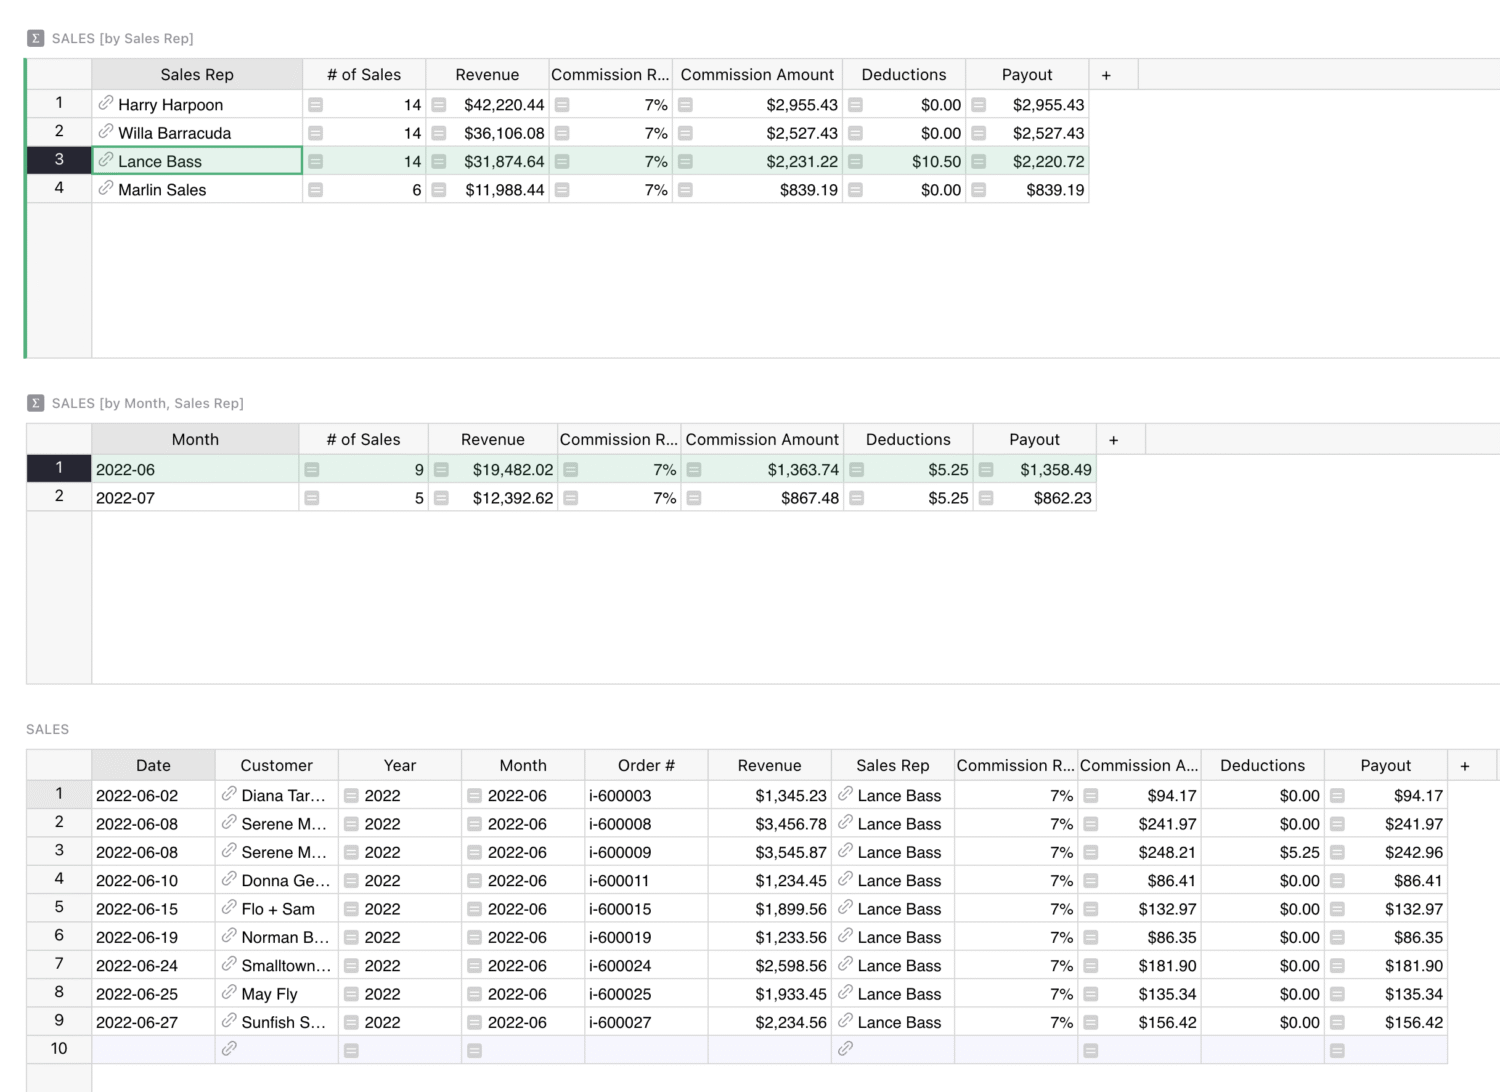
This page is where managers (document owners) and the rest of the sales team (editors or viewers) can see all their recorded sales in a particular time frame, as well as their calculated commission rates and overall payout.
Select a rep and a month to drill into sales. Managers can see all data. However, using preset access rules, reps can only see their sales and commission details, as well as every rep’s total revenue on this leaderboard.
To make updates, team members can easily record their own sales in the ‘Sales’ table at the bottom of this page, including the date, customer, revenue, and any additional relevant information to the sale.
How to use the Sales Over Time page
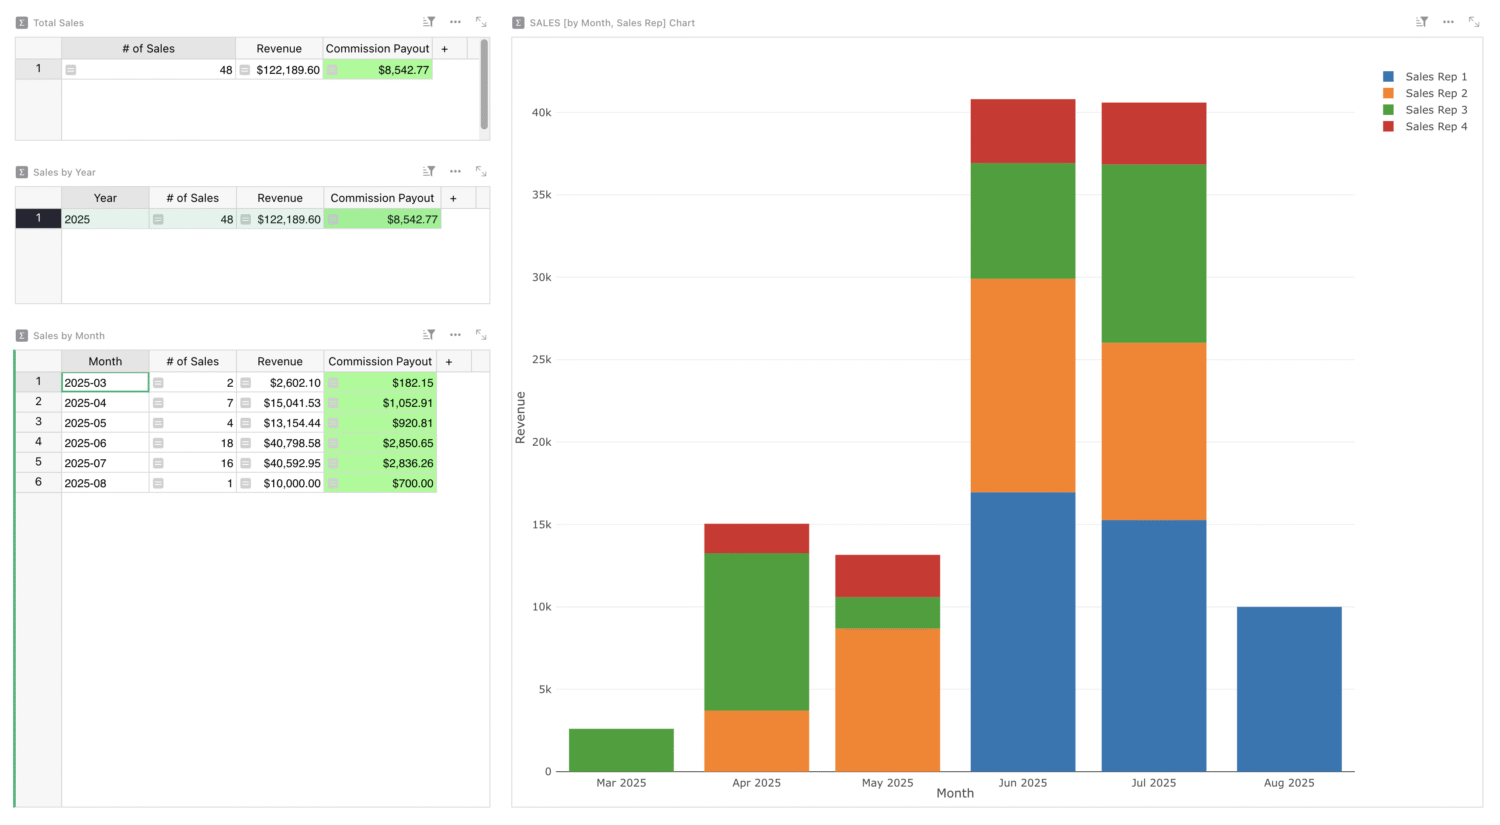
Only managers can see metrics from the entire sales team over time. This shows all-time sales, and sales broken down by year and month.
This template automatically calculates your performance metrics, including commission rates, monthly sales, and all sales commissions based on the data entered in the ‘Sales’ table within the Sales by Rep page, so you can focus more on insights and reporting.
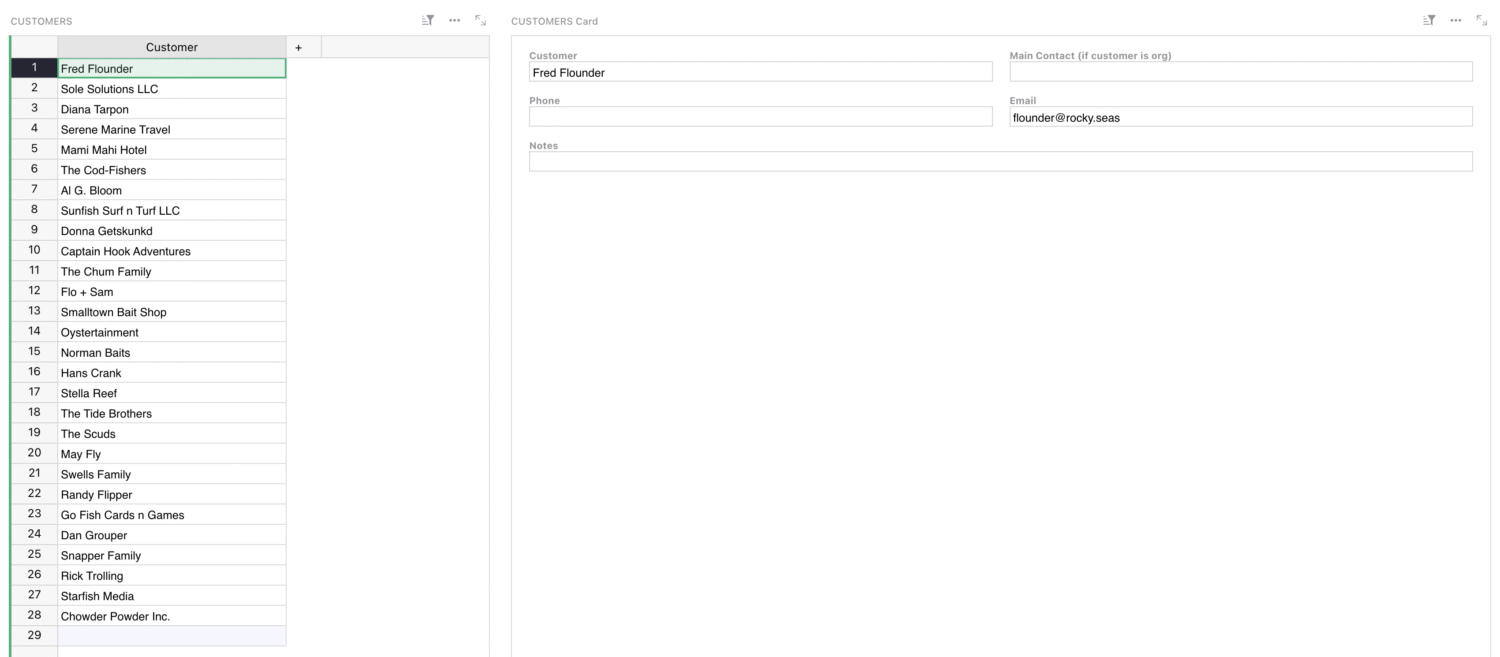
How to use the Customers page
This page is a simple CRM to keep customer contact data in one place. Here is where your sales team.
To add updates, simply create a new row and enter any relevant contact information, including new fields necessary for your sales strategy.
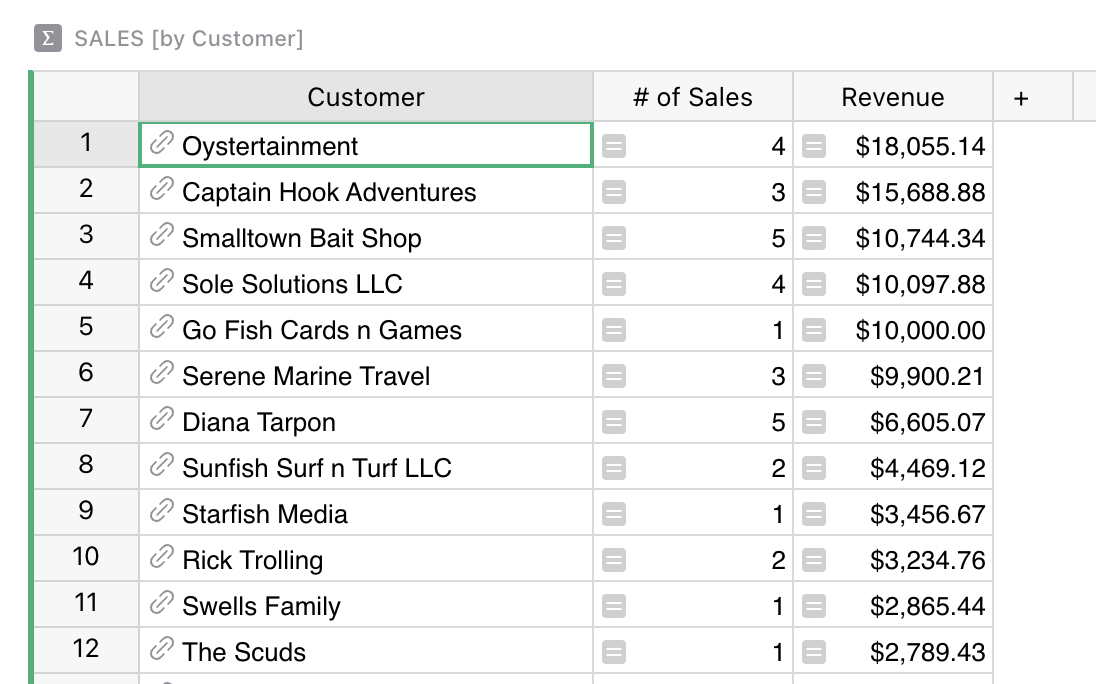
How to use the Sales by Customer page
See the lifetime value of your customers at a glance.
This page references all your listed customers on the Customers page, and then automatically calculates the amount of sales and revenue generated by the sales recorded in the original ‘Sales’ table.
There’s no need to add updates here!
How to view permissions for this doc’s users
With granular access rules, sales reps only see what’s relevant to them. Click on the “Users” button in the top right to view as any sales rep and compare what they can and cannot view when compared to their manager.
For example, Lance, a preset sales rep, only sees the main leaderboard, personal commission structure, and his own sales performance in the ‘Sales’ table at the bottom. No data will be leaked, and everyone on the sales team can store their data securely and collaboratively in the same place.
To learn more about Grist’s access rules, watch our comprehensive access rules webinar covering everything you need to know.